Map Viewer

Map Viewer is application into ArcGIS Explorer allows you simple mapping. Application allows you create stations layer from data stored in CLIDATA database and display these data in KML format in ArcGIS Explorer or display these data in Google Earth (GE).
There are tools:
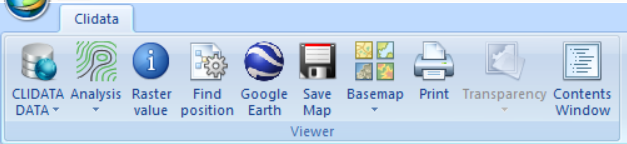
- Clidata data for creating stations layer from data stored in CLIDATA
- Analysis set of tools like interpolation, import,export etc.
- Raster value for get value from raster layer (interpolate surface)
- Find position for find position on map by entry coordinates
- Google Earthallow open selected layer in Google Earth application
- Save Map export map into PNG image file
- Basemap allows you choose background maps (basemaps)
- Print for printing
- Transparency for change transparency of selected layer
- Contents Window for open contents window in the left panel in case you close this panel
CLIDATA DATA
GEOGRAPHY

Tool is used for mapping stations according to element which measure in given date.
- Date definition of date for which stations measure given element
- Element selection of element
- Conditions optional conditions (like -> and elevation > 500)
- Label which field will be used for labeling in map
- Symbol for change symbol of point
- Show SQL for display generate SQL according to forms setting
RDATA

Tool is used for displaying daily measure data from data table RDATA_R or RDATA_N
- Date definition of date
- Time definition of measure time
- RDATA switch between non-regular data RDATA_N and regular data RDATA_R
- Element selection of element
- Conditions optional conditions (like -> elevation > 500)
- Label which field will be used for labeling in map
- Show SQL for display generate SQL according to forms setting
MDATA

This tool is used for download monthly data from Clidata server (table MDATA).
- Date definition of date in format MM.YYYY (05.2015)
- Time definition of measure time
- Non-regular / Regular switch between non-regular data
- Element selection of element
- Type type of monthly calculation (0-month, 1- 1decade……….)
- Function select monthly calculation function (MIN,MAX, SUM, AVG)
- Conditions optional conditions (like -> elevation > 500)
- Symbol modify default symbol for points
- Show SQL for display generate SQL according to forms setting
- Load load data from database into table in this form
- Make convert all selected records in table (CanUse) into layer and show in map
- CSV export data from table into text file (format CSV)
- Table display loaded data in table form
- Graph display loaded data in chart, where X-axis is measure value, Y-axis stations altitude.
EDATA

This tool is used for download extreme’s data (long time data) from Clidata server (table EDATA).
- Date definition of month in format MM (05)
- Time definition of measure time
- Non-regular / Regular switch between non-regular data
- Element selection of element
- Source type of source of EDATA (S-standart , P-provisory, F-full)
- Function choose long time statistic function (AVERAGE, MINIMUM, MAXIMUM)
- Conditions optional conditions (like -> elevation > 500)
- Symbol modify default symbol for points
- Show SQL for display generate SQL according to forms setting
- Load load data from database into table in this form
- Make convert all selected records in table (CanUse) into layer and show in map
- CSV export data from table into text file (format CSV)
- Table display loaded data in table form
- Graph display loaded data in chart, where X-axis is measure value, Y-axis stations altitude.
NDATA
This tool is used for download normal’s data (long time data) from Clidata server (table NDATA).
- Date definition of month in format MM (05)
- Time definition of measure time
- Non-regular / Regular switch between non-regular data
- Element selection of element
- Period choose pre-defined period for normal
- Source choose S – standard, P- provisory, U-user
- Homogenity homogenity switch
- Conditions optional conditions (like -> elevation > 500)
- Symbol modify default symbol for points
- Show SQL for display generate SQL according to forms setting
- Load load data from database into table in this form
- Make convert all selected records in table (CanUse) into layer and show in map
- CSV export data from table into text file (format CSV)
- Table display loaded data in table form
- Graph display loaded data in chart, where X-axis is measure value, Y-axis stations altitude.
SQL

Tool allows you to display data according to user SQL Query: name of the query Description: more detail information about query SQL: SQL query. Result of query have to contain at least geogr1 for X ,geogr2 of Y coordinates X Field: definition which field in SQL will be used for X coordinate Y Field: definition which field in SQL will be used fo r Y coordinate Label: definition which field in SQL will be used for labelling or empty in case you will not label SAVE: button for save your query for future use Symbol: change default symbol for points OK: for creating KML layer
CSV

Tool allows you to display in application data out for Clidata database (from text file) Text file: import text file in format CSV with station’s data Separator: choose separator character for given CSV file X : definition which field in CSV will be used for X coordinate Y : definition which field in CSV will be used fo r Y coordinate 11 VALUE : definition which field in CSV will be used for data Label: definition which field in SQL will be used for labelling or empty in case you will not label OK: for creating KML layer
ANALYSIS
Import layer
Tool allows you to open ArcGIS layer (file lyr) and show in application Tool allows you to open ESRI Ascii grid (*.asc) as raster layer
Export layers
Export selected station’s layer into ESRI ShapeFile Export selected raster layer into more GIS rasters format like (Erdas Imagine,Idrisi,Golden Software etc) Export selected raster layer (like interpolated surface) into ESRI Ascii grid format *.asc)
Interpolation
Tool allows you interpolate point station’s data into raster surface using interpolation technics. Method: choose interpolation method (IDW,LLR, ClidataDEM) Number of Stations: choose number of closest stations which will be use for interpolations Interpolation : checked mean interpolation, uncheck mean extrapolation(estimate value could be out off stations data interval) Save Pallete : allows you to store current color pallete for next uses OK : start interpolation process Result could look like
Histogram show how many areas fallen into given breaks. Picture displays histogram, where values less than 8.6 cover about 4% of area.
Make isolines
Tool allows you to create from interpolated surface isolines in shapefile format. Raster: choose raster layer as source for make isolines Isolines interval: choose interval between two closest isolines Example of result: 15
Grid calculator
Tool allows you to calculate simple math between two raster layers. It’s useful for create raster layer which represent for example difference between normal and monthly air temperature in given month. A: choose raster layer as variable A B: choose raster or number value as variable B Choose math: A-B, A/B100, AB, A/B, A+B 16 3.6 Set DEM Tools allows temporary change digital elevation model for interpolation tasks. Raster: choose from the list country DEM file Set DEM: set chosen asc file as temporary DEM Reset: set DEM to default
Raster value
Tool allows extract from selected raster layer value in position there user clicks.
Find position
Tool allows you to find position in the map if you know coordinates.
(Y): set latitude in degrees Or in decimals (X): set longitude in degrees Or in decimals Given position will be displays in map like this symbol 18
View in Google Earth
Tool allows viewing selected stations layer in Google Earth application
BaseMaps
Tool allows you to choose basemap
Save Map
Tool allows exporting map into PNG file. 20 Map Title: write your own title for map File: set PNG file for export Legend title: set legend title for given map Export: create map into given PNG file View: show preview of exported PNG file