Area Control
One of the last quality control flow in CLIDATA application is Area control in GIS. This control task uses comparison between measured data in given term with their long term average calculate on given station. So, result says if given measure term on given station is normal, lower of higher than long term average. Every station has own square symbol on their position filled by colour. There are 16 classes:
- (Blue) mean value is very lower than long term average (up to 1% of empirical probability) -> EXTREME LOW VALUE
- 1% - 2%
- 2% - 5%
- 5% - 10%
- 10% - 20%
- 20% - 30%
- 30% - 40%
- 40% - 50% (long term average value)
- 50% - 60%
- 60% - 70%
- 70% - 80%
- 80% - 90%
- 90% - 95%
- 95% - 98%
- 98% - 99%
- 99% (Red) mean values is very higher than long term average -> EXTREME HIGHT VALUE
Area Control Condition
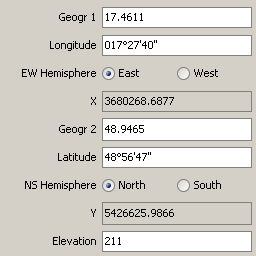
- Station must to have latitude, longitude, elevation defined in GEOGRAPHY
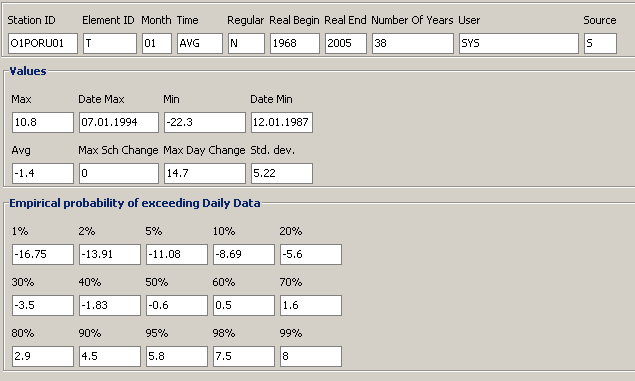
- Station must to have calculated extreme values in EDATA with source flag S or P
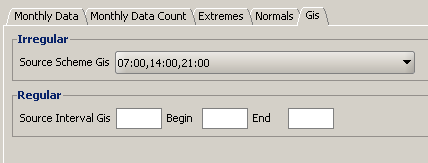
- Element must to have defined time scheme in GIS tab in ELEMENT
Area Control Main Form

Is the main form of Area Control application.
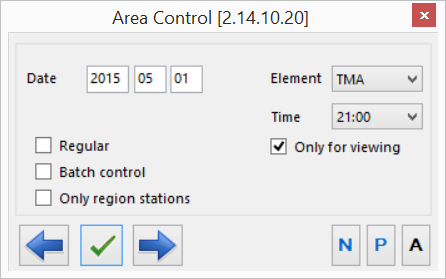
Where:
- Date is term which will be used for Area Control for manual control term by term or date from which will be up to end of given month will do batch control (automatically check control).
- Element selection of all elements which are ready for Area Control (has defined time schedule in definition of element in GIS tab)
- Timetime for given Date and given Element
- Regular checked is used for control regular data (RDATA_R). Unchecked is used for control non regular data (RDATA_N)
- Batch Control checked mean that will do batch control (automatic) from day in Date field to end of given month, unchecked mean that uses will control data manually term by term .
- Only region stations in case you have more than one regional database you can see on map only regional stations
- Only for viewing checked mean View only mode (any changes will not be store in database), unchecked mean that change of validation flags will be store in database.
 Go to previous term
 Start automatic (batch) or manual area control process
 Go to next term
 Search all stations in map in given term, which has not been control in Clidata by formulas (don't have P, W validation flag)
 Search for all station in map in given month, which has not been control in Clidata by formulas (don't have P, W validation flag)
 Search for all stations which have not been control in Area Control yet in given month and element
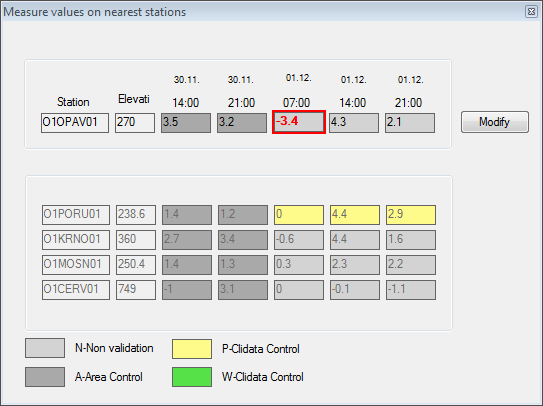
Measured Values

This tool is used for display measured values on selected stations in given term (red rectangle) and two terms before and two terms after (Figure 4) . You can see in the form also measures values from 4 nearest stations from selected station. There are 7 columns (station's id, station elevation, measure value 2 terms before, 1 term before, given term, 1 term after, 2 terms after. Values cells are colour by 4 colours:
- Grey means that given value has not been control yet
- Yellow means values passed quality control in Clidata (by formulas) without any errors or warnings (P)
- Green means values passed quality control in Clidata but with some warnings (W)
- Dark grey means values was control by Area Control in the past (A)
If you want to change or modify measure value for selected station (red rectangle) you can do it by press button Modify then KEF (Key Entry Form) will be open
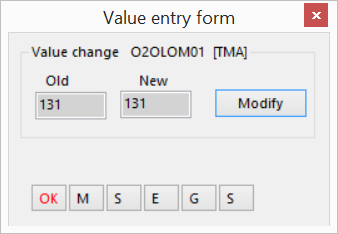
Where
- Old mean old value stored in Clidata
- New mean used defined new value
- Modify write new value instead of old value to database
- N null value, empty field, the 'M' symbol is assigned to value
- S set value as standard correct value, no any flag is assigned
- E estimated value, flag 'E' is assigned to value
- G guessed value, flag 'G' is assigned to value
Estimate Value

Area Control has tool for estimate value from a rounding stations in case that on given station are bad or incorrect values.
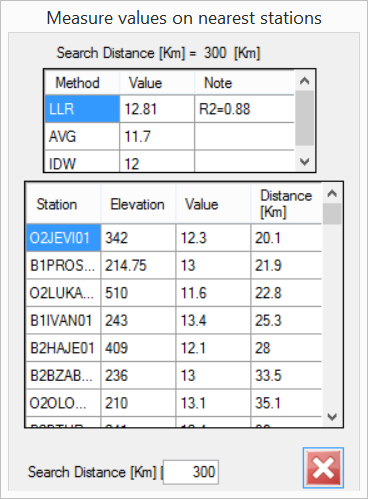
Where:
- Search Distance show distance in kilometers for searching nearest stations. Default value for searching distance is defined in parameter *
search_distance_kminclidataGIS\bin\Starter\ClidataGIS_L3.xmlconfiguration file. - Method method for estimate value.
- LLR mean local linear regression (value and elevation)
- AVG mean average mean from searched stations
- IDW mean inverse distance weighted avegare
- Value estimate value for given method
- Note additional information for given method
- CanUse station will used in calculations
- Station id of station
- Elevation station elevation
- Value measure value on given term
- Distance distance between point on map where user clicked and given meteorological station in kilometers
- Refresh click to recalculate selected stations (CanUse)
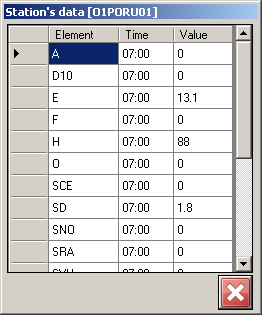
Station's Data

Tool allows you to show all data in given term measure on given station. Choose this tool in toolbar and click on a station. You will get form like:
Radar
 Tool allows you to display in the background radar image (24h sum composition) from local network path. Path pattern is defined in
 C:\ClidataGIS\AGE\CLIDATA\images\radar\ini\radar.ini file
There are some patterns:
- @YYYY for year
- @MM for month
- @DD for day.
Example: R:\radar\images\sumradar@YYYY@[email protected] will be in the term of 15.07.2016 transform into R:\radar\images\sum_radar2016_07_15.png.
Batch Control
Batch control tool allows to control term by term in the background. Batch control will start from day defined in main form in field Date. Batch control will stop in the end for given month. So in case that user has defined day in main form as 2016.07.25 then batch control will start from 25th to 31st of July.
After batch control will finish batch control report will be show in the application.
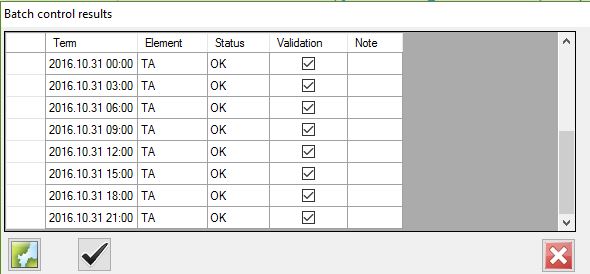
 click on button will display in the map selected term
 click on button will validate all rows with checked columns Validation. All stations with P or W will validate to A for all selected terms (Validation checkbox)